Social media continues to evolve at a rapid pace, shaping how we communicate, market, and engage online. With new platforms emerging and user behaviour shifting, staying updated on the latest statistics is crucial for businesses, marketers, and content creators.
In this guide, we’ve gathered the most important social media statistics for 2025 to help you understand audience preferences, platform growth, and engagement strategies.
Whether you’re optimising your marketing efforts or simply staying ahead of the curve, these insights will give you a competitive edge in the digital landscape.
Top Level Social Media Statistics
- As of 2025, there are now 5.85 billion social media users worldwide, accounting for around 72% of the global population. Of these, the average user uses 6.83 different social networks per month. With users juggling nearly seven platforms a month, brands can’t afford a single-channel approach to their digital marketing strategy.
- Users spend an average of 2 hours and 36 minutes daily on social media platforms.
- Social media advertising revenue has now surpassed $200 billion dollars globally, reflecting brands’ and businesses’ substantial investment into digital marketing services.
UK Social Media Statistics
- WhatsApp leads as the most used and favoured social media platform in the UK, followed by Facebook and then Instagram. This means that brands should utilise a multi-platform strategy , leveraging WhatsApp for direct engagement, Facebook for community building and Instagram for visual storytelling.
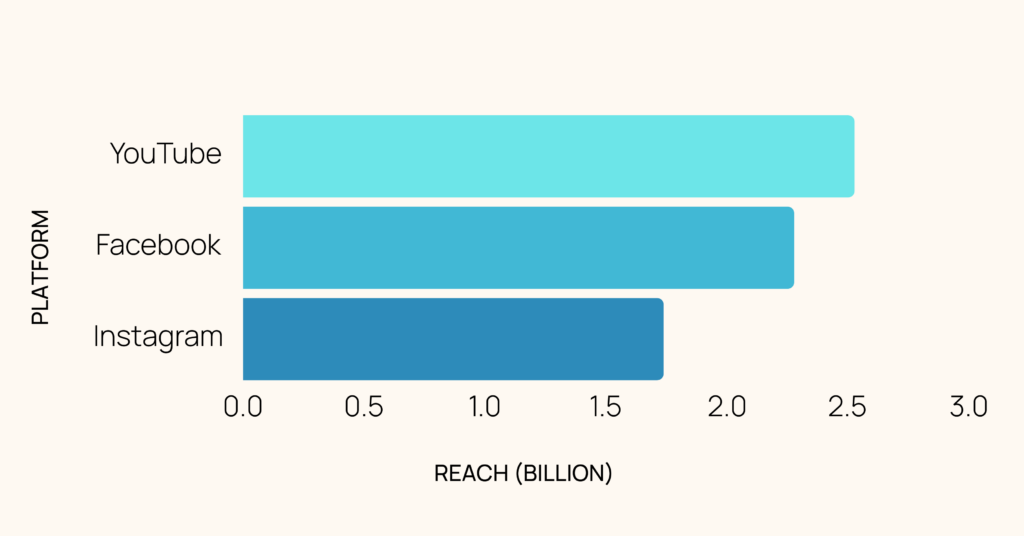
- In February 2025, it was shown that YouTube ads reached around 2.53 billion individuals, followed by Facebook (2.28 billion) and Instagram (1.74 billion). With YouTube ads becoming increasingly more popular, brands and businesses should be focusing their efforts to create longer-form video content targeted for YouTube audiences.
- In the UK, mobile is the most-used device, with over 98% of users logging in through their mobile devices. About 1.5% of users log in through their laptops or desktops. As a brand this means that all content should be optimised for mobile use.

Platform Specific Statistics
- According to a 2023 Statista report, 50% of Instagram users seek funny content on the platform, 46% creative content, 41% informative and 37% relaxing content.
- In 2024, YouTube’s advertising revenue was $36.1 billion, which was about 13.66% of Google’s total ad revenue. This was an increase from $31.5 billion in 2023 – a record high statistic for YouTube.
- About 69.4% of TikTok users belong to the 18-34 year age bracket. If you’re a brand whose target audience is within those age brackets, it is suggested that having a presence on TikTok is crucial in gaining brand awareness and generating revenue.
- LinkedIn’s platform user base is expected to increase by 22.3% between 2024 and 2028, to reach an estimated user base of 942.84 million by 2028 – this means that now is a better time than ever to launch your brand’s LinkedIn presence.
Social Media Statistics By Demographic
- 83% of users rely on social media for product discovery, highlighting its role in consumer journeys. Features like Instagram Shop and TikTok Shop make it easier for brands to integrate a shopping experience onto their social media platforms, and make it easier for consumers to purchase products.
- Both Instagram and Facebook are particularly popular amongst high-income households, with over 54% of users of Instagram earning more than $70,000 per annum. Both platform’s ageing demographics mean that marketers targeting decision-markets and high-income consumers should take full advantage.
- In research conducted by Keevee, 74% of consumers said that they follow brands they like on social media, indicating strong brand-consumer relationships. Brands should focus on consistent, high-value content that resonates with their audiences and continue to encourage UGC in order to strengthen their authentic brand voice.
- It is shown that 59% of users prefer video content on social media, with short-form and live videos driving engagement. Investing in high-quality, engaging video marketing strategies can significantly boost visibility, conversions and overall brand engagements.
Social Media Industry Statistics
- Social media advertising budgets used by brands and businesses are growing by 18% annually, reflecting businesses’ prioritisation of digital marketing investments. The increasing investment in social media advertising highlights the need for brands to allocate a competitive budget to stay visible and relevant in crowded digital spaces.
- Influencer marketing generates around £15.5 billion in revenue annually, with collaborations becoming a key part of marketing strategies. Consumers trust recommendations from influencers, making influencer partnerships a valuable tool for brand credibility and awareness.
- Social commerce is no longer just an add-on; it’s becoming a primary revenue stream, meaning brands must optimise their social media storefronts for seamless shopping experiences. Social media commerce sales are projected to reach £1.1 trillion in 2025, with platforms like Instagram and TikTok playing significant roles.

Summary
Social media is evolving rapidly, and staying informed on the latest trends and statistics is crucial for businesses and marketers.
In 2025, key statistics highlight the growing impact of social platforms on consumer behaviour, with 74% of users following brands they like and video content driving the highest social engagement.
Brands must leverage these insights to refine their strategies, optimise engagement, and maximise digital marketing success.
For businesses looking to thrive in 2025, a strategic approach that integrates advertising, influencer partnerships, video content, and social commerce will be key to staying ahead in the ever-evolving digital landscape. Get in touch with CEEK Marketing today to see how we can transform your brand’s social media strategy.


